
Construction – Relative Sector Size and Growth
The Bureau of Labor Statistics indicates that the Construction sector will grow substantially over the next several years.
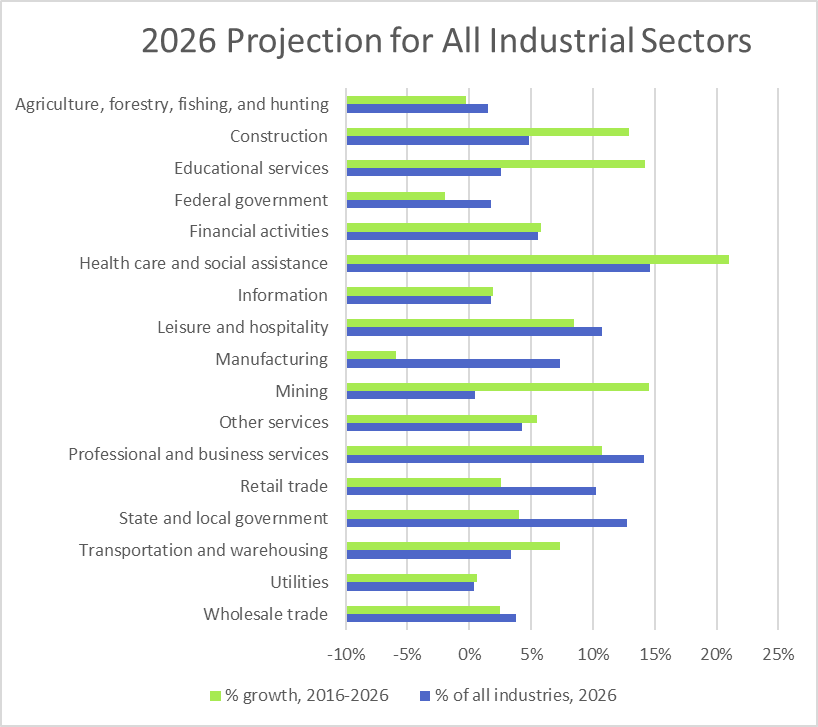
Projected Growth for Main Industry Sectors
Specialty Trade Contractors
Within the Construction sector, Specialty Trade Contractors is the largest industry with more than 60% of the employment for the entire sector.
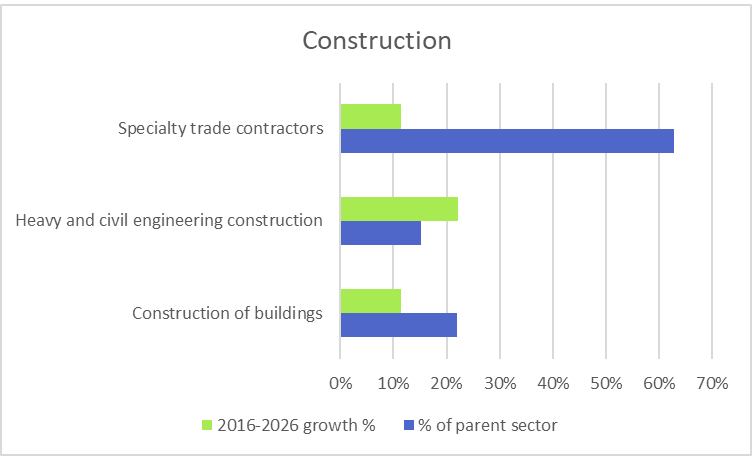
Construction Industry Segments
Specialty Trade Contractors Industry Groups
The Specialty Trade Contractors industry includes the following industry groups
- Foundation, Structure, and Building Exterior Contractors
- Building Equipment Contractors
- Building Finishing Contractors
- Other Specialty Trade Contractors
Specialty Trade Contractors Occupational Opportunities
The following lists the largest and fastest growing occupations in the Specialty Trade Contractors industry for 2026.
- Electricians (largest)
- Construction laborers (largest)
- Plumbers, pipefitters, and steamfitters (largest and fastest growing)
- Heating, air conditioning, and refrigeration mechanics and installers (largest and fastest growing)
- Carpenters (largest)
- First-line supervisors of construction trades and extraction workers (largest)
- Painters, construction and maintenance (largest)
- Office clerks, general (largest)
- Cement masons and concrete finishers (largest)
- Roofers (largest)
- Solar photovoltaic installers (fastest growing)
- Computer numerically controlled machine tool programmers, metal and plastic (fastest growing)
- Stationary engineers and boiler operators (fastest growing)
- Helpers–pipelayers, plumbers, pipefitters, and steamfitters (fastest growing)
Electricians Outlook
Electricians are projected to be one of the largest occupations in the Specialty Trade Contractors industry.
Electricians- Size and Growth
The following indicates the projected size and growth for electricians.
| Occupation | 2026 Projected Employment (in thousands) | 2026 Projected Percent of Subsector | Percent Employment Change (2016-2026) | Education Requirements | OJT Requirements |
| Electricians | 491.7 | 10.3 | 10.5 | High school diploma or equivalent | Apprenticeship |
Electricians – Highest Proportional Concentrations by State
The following shows the states with the highest concentration of jobs, relative to the nation as a whole, for electricians.
| State | Employment | Employment per thousand jobs | Location quotient | Hourly mean wage | Annual mean wage |
| North Dakota | 3,540 | 8.49 | 1.92 | $30.18 | $62,780 |
| Wyoming | 2,240 | 8.37 | 1.89 | $27.62 | $57,460 |
| Utah | 9,430 | 6.68 | 1.51 | $25.61 | $53,280 |
| Louisiana | 11,470 | 6.03 | 1.36 | $24.56 | $51,090 |
| Colorado | 15,070 | 5.90 | 1.33 | $25.57 | $53,180 |
Electricians – Highest Proportional Concentrations by Metropolitan Area
The following shows the metropolitan areas with the highest concentration of jobs, relative to the nation as a whole, for electricians.
| Metropolitan area | Employment | Employment per thousand jobs | Location quotient | Hourly mean wage | Annual mean wage |
| Gulfport-Biloxi-Pascagoula, MS | 2,180 | 14.53 | 3.28 | $26.46 | $55,040 |
| Provo-Orem, UT | 3,090 | 13.47 | 3.04 | $26.08 | $54,240 |
| Odessa, TX | 820 | 12.00 | 2.71 | $22.39 | $46,570 |
| Bremerton-Silverdale, WA | 1,030 | 11.91 | 2.69 | $26.93 | $56,010 |
| Homosassa Springs, FL | 370 | 11.42 | 2.58 | $18.56 | $38,600 |
| Lowell-Billerica-Chelmsford, MA-NH NECTA Division | 1,670 | 10.73 | 2.42 | $28.55 | $59,380 |
| Mobile, AL | 1,790 | 10.37 | 2.34 | $22.97 | $47,780 |
| Decatur, IL | 500 | 10.14 | 2.29 | $29.90 | $62,190 |
| Casper, WY | 370 | 9.71 | 2.19 | $27.84 | $57,920 |
| Oshkosh-Neenah, WI | 860 | 9.02 | 2.04 | $26.61 | $55,360 |
Construction Laborers Outlook
Construction laborers are projected to be one of the largest occupations in the Specialty Trade Contractors industry.
Construction Laborers – Size and Growth
The following indicates the projected size and growth for construction laborers.
| Occupation | 2026 Projected Employment (in thousands) | 2026 Projected Percent of Subsector | Percent Employment Change (2016-2026) | Education Requirements | OJT Requirements |
| Construction laborers | 376.6 | 7.9 | 12.0 | No formal educational credential | Short-term on-the-job training |
Construction Laborers – Highest Proportional Concentrations by State
The following shows the states with the highest concentration of jobs, relative to the nation as a whole, for construction laborers.
| State | Employment | Employment per thousand jobs | Location quotient | Hourly mean wage | Annual mean wage |
| North Dakota | 4,960 | 11.89 | 1.76 | $19.56 | $40,680 |
| West Virginia | 7,410 | 10.77 | 1.60 | $16.97 | $35,290 |
| New Mexico | 8,630 | 10.77 | 1.60 | $14.89 | $30,960 |
| Wyoming | 2,860 | 10.67 | 1.58 | $17.29 | $35,970 |
| Montana | 4,850 | 10.52 | 1.56 | $17.99 | $37,430 |
Construction Laborers – Highest Proportional Concentrations by Metropolitan Area
The following shows the metropolitan areas with the highest concentration of jobs, relative to the nation as a whole, for construction laborers.
| Metropolitan area | Employment | Employment per thousand jobs | Location quotient | Hourly mean wage | Annual mean wage |
| Lake Charles, LA | 3,910 | 34.92 | 5.17 | $19.73 | $41,050 |
| Parkersburg-Vienna, WV | 760 | 20.40 | 3.02 | $15.93 | $33,140 |
| Cape Coral-Fort Myers, FL | 4,850 | 18.79 | 2.78 | $14.37 | $29,900 |
| Greeley, CO | 1,790 | 18.43 | 2.73 | $17.43 | $36,260 |
| St. George, UT | 1,080 | 17.16 | 2.54 | $14.59 | $30,350 |
| Great Falls, MT | 610 | 17.15 | 2.54 | $19.22 | $39,980 |
| Beaumont-Port Arthur, TX | 2,700 | 16.83 | 2.49 | $16.17 | $33,630 |
| Pittsfield, MA | 640 | 16.13 | 2.39 | $22.54 | $46,870 |
| Farmington, NM | 760 | 15.60 | 2.31 | $14.75 | $30,680 |
| Odessa, TX | 1,020 | 14.91 | 2.21 | $17.61 | $36,620 |
Plumbers, Pipefitters, and Steamfitters Outlook
Plumbers, pipefitters, and steamfitters are projected to be one of the largest and fastest growing occupations in the Specialty Trade Contractors industry.
Plumbers, Pipefitters, and Steamfitters – Size and Growth
The following indicates the projected size and growth for plumbers, pipefitters, and steamfitters.
| Occupation | 2026 Projected Employment (in thousands) | 2026 Projected Percent of Subsector | Percent Employment Change (2016-2026) | Education Requirements | OJT Requirements |
| Plumbers, pipefitters, and steamfitters | 372.9 | 7.8 | 19.4 | High school diploma or equivalent | Apprenticeship |
Plumbers, Pipefitters, and Steamfitters – Highest Proportional Concentrations by State
The following shows the states with the highest concentration of jobs, relative to the nation as a whole, for plumbers, pipefitters, and steamfitters.
| State | Employment | Employment per thousand jobs | Location quotient | Hourly mean wage | Annual mean wage |
| Louisiana | 10,850 | 5.70 | 1.90 | $25.45 | $52,930 |
| North Dakota | 1,760 | 4.23 | 1.41 | $24.01 | $49,950 |
| Oklahoma | 6,600 | 4.19 | 1.40 | $23.36 | $48,600 |
| Montana | 1,890 | 4.11 | 1.37 | $30.70 | $63,860 |
| Nebraska | 3,900 | 4.02 | 1.34 | $25.42 | $52,880 |
Plumbers, Pipefitters, and Steamfitters – Highest Proportional Concentrations by Metropolitan Area
The following shows the metropolitan areas with the highest concentration of jobs, relative to the nation as a whole, for plumbers, pipefitters, and steamfitters.
| Metropolitan area | Employment | Employment per thousand jobs | Location quotient | Hourly mean wage | Annual mean wage |
| Lake Charles, LA | 2,100 | 18.75 | 6.24 | $28.86 | $60,030 |
| Bremerton-Silverdale, WA | 980 | 11.33 | 3.77 | $28.59 | $59,460 |
| Odessa, TX | 640 | 9.37 | 3.12 | $20.21 | $42,030 |
| Baton Rouge, LA | 3,570 | 9.12 | 3.03 | $26.80 | $55,740 |
| Midland, MI | 300 | 8.69 | 2.89 | $25.06 | $52,120 |
| Kokomo, IN | 340 | 8.62 | 2.87 | $34.11 | $70,950 |
| Elizabethtown-Fort Knox, KY | 430 | 7.93 | 2.64 | $26.19 | $54,480 |
| Homosassa Springs, FL | 250 | 7.78 | 2.59 | $19.73 | $41,030 |
| Gulfport-Biloxi-Pascagoula, MS | 1,140 | 7.59 | 2.53 | $23.94 | $49,790 |
| Ocean City, NJ | 290 | 7.39 | 2.46 | $33.99 | $70,700 |
Heating, Air Conditioning, and Refrigeration Mechanics and Installers Outlook
Heating, air conditioning, and refrigeration mechanics and installers is projected to be one of the largest and fastest growing occupations in the Specialty Trade Contractors industry.
Heating, Air Conditioning, and Refrigeration Mechanics and Installers – Size and Growth
The following indicates the projected size and growth for heating, air conditioning, and refrigeration mechanics and installers.
| Occupation | 2026 Projected Employment (in thousands) | 2026 Projected Percent of Subsector | Percent Employment Change (2016-2026) | Education Requirements | OJT Requirements |
| Heating, air conditioning, and refrigeration mechanics and installers | 262.5 | 5.5 | 19.5 | Postsecondary nondegree award | Long-term on-the-job training |
Heating, Air Conditioning, and Refrigeration Mechanics and Installers – Highest Proportional Concentrations by State
The following shows the states with the highest concentration of jobs, relative to the nation as a whole, for heating, air conditioning, and refrigeration mechanics and installers.
| State | Employment | Employment per thousand jobs | Location quotient | Hourly mean wage | Annual mean wage |
| Florida | 29,450 | 3.50 | 1.62 | $20.32 | $42,260 |
| Delaware | 1,530 | 3.45 | 1.60 | $24.73 | $51,440 |
| North Carolina | 13,890 | 3.23 | 1.50 | $20.47 | $42,580 |
| Virginia | 11,690 | 3.09 | 1.43 | $23.81 | $49,520 |
| Vermont | 930 | 3.05 | 1.42 | $23.88 | $49,670 |
Heating, Air Conditioning, and Refrigeration Mechanics and Installers – Highest Proportional Concentrations by Metropolitan Area
The following shows the metropolitan areas with the highest concentration of jobs, relative to the nation as a whole, for heating, air conditioning, and refrigeration mechanics and installers.
| Metropolitan area | Employment | Employment per thousand jobs | Location quotient | Hourly mean wage | Annual mean wage |
| Cape Coral-Fort Myers, FL | 1,680 | 6.50 | 3.02 | $20.94 | $43,550 |
| Wilmington, NC | 730 | 5.94 | 2.76 | $21.45 | $44,620 |
| Crestview-Fort Walton Beach-Destin, FL | 630 | 5.90 | 2.74 | $20.04 | $41,680 |
| Panama City, FL | 450 | 5.59 | 2.60 | $18.85 | $39,200 |
| Punta Gorda, FL | 250 | 5.46 | 2.53 | $19.04 | $39,600 |
| Lawton, OK | 230 | 5.35 | 2.48 | $19.18 | $39,890 |
| Naples-Immokalee-Marco Island, FL | 730 | 5.10 | 2.37 | $21.71 | $45,160 |
| Myrtle Beach-Conway-North Myrtle Beach, SC-NC | 770 | 4.88 | 2.27 | $18.36 | $38,200 |
| Salisbury, MD-DE | 720 | 4.58 | 2.13 | $22.36 | $46,500 |
| Manhattan, KS | 170 | 4.58 | 2.13 | $22.17 | $46,110 |
Carpenters Outlook
Carpenters is projected to be one of the largest occupations in the Specialty Trade Contractors industry.
Carpenters – Size and Growth
The following indicates the projected size and growth for carpenters.
| Occupation | 2026 Projected Employment (in thousands) | 2026 Projected Percent of Subsector | Percent Employment Change (2016-2026) | Education Requirements | OJT Requirements |
| Carpenters | 247.4 | 5.2 | 10.1 | High school diploma or equivalent | Apprenticeship |
Carpenters – Highest Proportional Concentrations by State
The following shows the states with the highest concentration of jobs, relative to the nation as a whole, for carpenters.
| State | Employment | Employment per thousand jobs | Location quotient | Hourly mean wage | Annual mean wage |
| Wyoming | 2,760 | 10.29 | 2.12 | $23.53 | $48,940 |
| South Dakota | 4,100 | 9.79 | 2.01 | $17.20 | $35,770 |
| Montana | 4,300 | 9.33 | 1.92 | $21.11 | $43,900 |
| Idaho | 6,300 | 9.18 | 1.89 | $17.53 | $36,460 |
| Vermont | 2,780 | 9.11 | 1.87 | $20.77 | $43,200 |
Carpenters – Highest Proportional Concentrations by Metropolitan Area
The following shows the metropolitan areas with the highest concentration of jobs, relative to the nation as a whole, for carpenters.
| Metropolitan area | Employment | Employment per thousand jobs | Location quotient | Hourly mean wage | Annual mean wage |
| Lake Charles, LA | 2,190 | 19.57 | 4.02 | $28.55 | $59,390 |
| Bend-Redmond, OR | 1,230 | 15.69 | 3.23 | $19.51 | $40,570 |
| San Rafael, CA Metropolitan Division | 1,660 | 14.42 | 2.97 | $34.60 | $71,970 |
| Coeur d’Alene, ID | 840 | 14.06 | 2.89 | $18.52 | $38,510 |
| Rapid City, SD | 820 | 12.43 | 2.56 | $17.42 | $36,240 |
| Lancaster, PA | 2,780 | 11.53 | 2.37 | $19.33 | $40,210 |
| Punta Gorda, FL | 530 | 11.42 | 2.35 | $18.29 | $38,040 |
| Naples-Immokalee-Marco Island, FL | 1,600 | 11.22 | 2.31 | $20.38 | $42,380 |
| Ocean City, NJ | 430 | 11.12 | 2.29 | $23.52 | $48,920 |
| Barnstable Town, MA | 1,140 | 11.07 | 2.28 | $28.83 | $59,960 |
First-line Supervisors of Construction Trades and Extraction Workers Outlook
First-line supervisors of construction trades and extraction workers is projected to be one of the largest occupations in the Specialty Trade Contractors industry.
First-line Supervisors of Construction Trades and Extraction Workers – Size and Growth
The following indicates the projected size and growth for first-line supervisors of construction trades and extraction workers.
| Occupation | 2026 Projected Employment (in thousands) | 2026 Projected Percent of Subsector | Percent Employment Change (2016-2026) | Education Requirements | OJT Requirements |
| First-line supervisors of construction trades and extraction workers | 217.2 | 4.6 | 11.7 | High school diploma or equivalent | None |
First-line Supervisors of Construction Trades and Extraction Workers – Highest Proportional Concentrations by State
The following shows the states with the highest concentration of jobs, relative to the nation as a whole, for first-line supervisors of construction trades and extraction workers.
| State | Employment | Employment per thousand jobs | Location quotient | Hourly mean wage | Annual mean wage |
| Wyoming | 2,360 | 8.79 | 2.25 | $35.83 | $74,540 |
| North Dakota | 3,500 | 8.39 | 2.15 | $35.68 | $74,220 |
| New Mexico | 5,750 | 7.18 | 1.84 | $30.19 | $62,790 |
| Montana | 3,090 | 6.71 | 1.72 | $31.43 | $65,370 |
| West Virginia | 4,470 | 6.49 | 1.66 | $33.86 | $70,420 |
First-line Supervisors of Construction Trades and Extraction Workers – Highest Proportional Concentrations by Metropolitan Area
The following shows the metropolitan areas with the highest concentration of jobs, relative to the nation as a whole, for first-line supervisors of construction trades and extraction workers.
| Metropolitan area | Employment | Employment per thousand jobs | Location quotient | Hourly mean wage | Annual mean wage |
| Midland, TX | 1,520 | 17.27 | 4.43 | $41.24 | $85,770 |
| Odessa, TX | 1,070 | 15.70 | 4.02 | $36.50 | $75,920 |
| Farmington, NM | 690 | 14.21 | 3.64 | $34.81 | $72,400 |
| Greeley, CO | 1,290 | 13.26 | 3.40 | $32.43 | $67,450 |
| Enid, OK | 300 | 11.79 | 3.02 | $37.51 | $78,030 |
| Naples-Immokalee-Marco Island, FL | 1,650 | 11.59 | 2.97 | $31.09 | $64,660 |
| Beaumont-Port Arthur, TX | 1,680 | 10.48 | 2.69 | $32.76 | $68,140 |
| Baton Rouge, LA | 4,040 | 10.30 | 2.64 | $32.57 | $67,750 |
| Lake Charles, LA | 1,040 | 9.32 | 2.39 | $31.36 | $65,220 |
| Longview, TX | 830 | 9.24 | 2.37 | $31.83 | $66,200 |
Painters, Construction and Maintenance Outlook
Painters, construction and maintenance is projected to be one of the largest occupations in the Specialty Trade Contractors industry.
Painters, Construction and Maintenance – Size and Growth
The following indicates the projected size and growth for painters, construction and maintenance.
| Occupation | 2026 Projected Employment (in thousands) | 2026 Projected Percent of Subsector | Percent Employment Change (2016-2026) | Education Requirements | OJT Requirements |
| Painters, construction and maintenance | 156.1 | 3.3 | 2.9 | No formal educational credential | Moderate-term on-the-job training |
Painters, Construction and Maintenance – Highest Proportional Concentrations by State
The following shows the states with the highest concentration of jobs, relative to the nation as a whole, for painters, construction and maintenance.
| State | Employment | Employment per thousand jobs | Location quotient | Hourly mean wage | Annual mean wage |
| Hawaii | 2,010 | 3.18 | 2.05 | $26.39 | $54,900 |
| Washington | 9,670 | 3.04 | 1.95 | $19.82 | $41,220 |
| Louisiana | 5,330 | 2.80 | 1.80 | $19.46 | $40,480 |
| Nevada | 3,410 | 2.60 | 1.67 | $21.58 | $44,900 |
| Idaho | 1,680 | 2.46 | 1.58 | $16.15 | $33,590 |
Painters, Construction and Maintenance – Highest Proportional Concentrations by Metropolitan Area
The following shows the metropolitan areas with the highest concentration of jobs, relative to the nation as a whole, for painters, construction and maintenance.
| Metropolitan area | Employment | Employment per thousand jobs | Location quotient | Hourly mean wage | Annual mean wage |
| Bremerton-Silverdale, WA | 820 | 9.49 | 6.11 | $25.25 | $52,530 |
| Naples-Immokalee-Marco Island, FL | 1,190 | 8.34 | 5.37 | $16.03 | $33,340 |
| Sebastian-Vero Beach, FL | 340 | 6.71 | 4.32 | $15.71 | $32,670 |
| San Rafael, CA Metropolitan Division | 690 | 5.99 | 3.86 | $23.08 | $48,000 |
| Corpus Christi, TX | 870 | 4.58 | 2.95 | $20.59 | $42,830 |
| Lynn-Saugus-Marblehead, MA NECTA Division | 200 | 4.57 | 2.94 | $21.71 | $45,150 |
| Houma-Thibodaux, LA | 350 | 4.16 | 2.68 | $18.06 | $37,570 |
| Salem, OR | 670 | 4.06 | 2.62 | $15.81 | $32,890 |
| Warner Robins, GA | 280 | 4.03 | 2.60 | $25.15 | $52,310 |
| Napa, CA | 290 | 4.00 | 2.58 | $25.38 | $52,790 |
Cement Masons and Concrete Finishers Outlook
Cement masons and concrete finishers is projected to be one of the largest occupations in the Specialty Trade Contractors industry.
Cement Masons and Concrete Finishers – Size and Growth
The following indicates the projected size and growth for cement masons and concrete finishers.
| Occupation | 2026 Projected Employment (in thousands) | 2026 Projected Percent of Subsector | Percent Employment Change (2016-2026) | Education Requirements | OJT Requirements |
| Cement masons and concrete finishers | 137.4 | 2.9 | 12.2 | No formal educational credential | Moderate-term on-the-job training |
Cement Masons and Concrete Finishers – Highest Proportional Concentrations by State
The following shows the states with the highest concentration of jobs, relative to the nation as a whole, for cement masons and concrete finishers.
| State | Employment | Employment per thousand jobs | Location quotient | Hourly mean wage | Annual mean wage |
| South Dakota | 2,080 | 4.97 | 3.96 | $17.80 | $37,030 |
| Nebraska | 3,310 | 3.41 | 2.72 | $17.73 | $36,880 |
| Idaho | 2,260 | 3.29 | 2.63 | $17.63 | $36,680 |
| Wyoming | 690 | 2.56 | 2.05 | $19.30 | $40,150 |
| North Dakota | 1,000 | 2.40 | 1.92 | $22.18 | $46,130 |
Cement Masons and Concrete Finishers – Highest Proportional Concentrations by Metropolitan Area
The following shows the metropolitan areas with the highest concentration of jobs, relative to the nation as a whole, for cement masons and concrete finishers.
| Metropolitan area | Employment | Employment per thousand jobs | Location quotient | Hourly mean wage | Annual mean wage |
| Rapid City, SD | 440 | 6.77 | 5.40 | $17.36 | $36,120 |
| Sioux Falls, SD | 700 | 4.63 | 3.69 | $18.44 | $38,360 |
| Grand Island, NE | 160 | 4.11 | 3.28 | $18.78 | $39,070 |
| Lincoln, NE | 710 | 4.02 | 3.21 | $17.73 | $36,880 |
| Naples-Immokalee-Marco Island, FL | 570 | 3.99 | 3.18 | $16.91 | $35,160 |
| Provo-Orem, UT | 910 | 3.97 | 3.17 | $18.70 | $38,890 |
| Boise City, ID | 1,220 | 3.96 | 3.16 | $17.51 | $36,410 |
| Greeley, CO | 360 | 3.73 | 2.98 | $20.24 | $42,100 |
| Iowa City, IA | 330 | 3.55 | 2.83 | $19.49 | $40,540 |
| Ogden-Clearfield, UT | 880 | 3.52 | 2.81 | $18.33 | $38,130 |
Roofers Outlook
Roofers is projected to be one of the largest occupations in the Specialty Trade Contractors industry.
Roofers – Size and Growth
The following indicates the projected size and growth for roofers.
| Occupation | 2026 Projected Employment (in thousands) | 2026 Projected Percent of Subsector | Percent Employment Change (2016-2026) | Education Requirements | OJT Requirements |
| Roofers | 121.1 | 2.5 | 12.5 | No formal educational credential | Moderate-term on-the-job training |
Roofers – Highest Proportional Concentrations by State
The following shows the states with the highest concentration of jobs, relative to the nation as a whole, for roofers.
| State | Employment | Employment per thousand jobs | Location quotient | Hourly mean wage | Annual mean wage |
| Florida | 17,860 | 2.12 | 2.50 | $16.59 | $34,510 |
| Oregon | 3,010 | 1.64 | 1.93 | $19.70 | $40,980 |
| New Mexico | 1,300 | 1.62 | 1.91 | $15.07 | $31,350 |
| Utah | 2,170 | 1.54 | 1.81 | $17.76 | $36,930 |
| Hawaii | 960 | 1.52 | 1.79 | $25.53 | $53,100 |
Roofers – Highest Proportional Concentrations by Metropolitan Area
The following shows the metropolitan areas with the highest concentration of jobs, relative to the nation as a whole, for roofers.
| Metropolitan area | Employment | Employment per thousand jobs | Location quotient | Hourly mean wage | Annual mean wage |
| Morristown, TN | 230 | 5.47 | 6.43 | $12.84 | $26,700 |
| Longview, WA | 200 | 5.34 | 6.29 | $22.45 | $46,700 |
| Cape Coral-Fort Myers, FL | 1,210 | 4.67 | 5.49 | $17.26 | $35,910 |
| North Port-Sarasota-Bradenton, FL | 1,340 | 4.62 | 5.44 | $15.53 | $32,300 |
| Homosassa Springs, FL | 150 | 4.59 | 5.40 | $18.89 | $39,290 |
| Elmira, NY | 150 | 4.40 | 5.17 | $19.11 | $39,760 |
| Sebastian-Vero Beach, FL | 210 | 4.18 | 4.92 | $20.59 | $42,830 |
| Deltona-Daytona Beach-Ormond Beach, FL | 790 | 4.14 | 4.87 | $15.25 | $31,730 |
| Port St. Lucie, FL | 510 | 3.63 | 4.27 | $17.95 | $37,330 |
| Greeley, CO | 300 | 3.05 | 3.58 | $20.71 | $43,090 |
Solar Photovoltaic Installers Outlook
Solar photovoltaic installers is projected to be one of the fastest growing occupations in the Specialty Trade Contractors industry.
Solar Photovoltaic Installers – Size and Growth
The following indicates the projected size and growth for solar photovoltaic installers.
| Occupation | 2026 Projected Employment (in thousands) | 2026 Projected Percent of Subsector | Percent Employment Change (2016-2026) | Education Requirements | OJT Requirements |
| Solar photovoltaic installers | 18.8 | 0.4 | 148.1 | High school diploma or equivalent | Moderate-term on-the-job training |
Solar Photovoltaic Installers – Highest Proportional Concentrations by State
The following shows the states with the highest concentration of jobs, relative to the nation as a whole, for solar photovoltaic installers.
| State | Employment | Employment per thousand jobs | Location quotient | Hourly mean wage | Annual mean wage |
| Vermont | 370 | 1.21 | 19.09 | $19.01 | $39,540 |
| Hawaii | 190 | 0.30 | 4.68 | $26.41 | $54,930 |
| California | 3,900 | 0.23 | 3.70 | $21.61 | $44,950 |
| New Jersey | 750 | 0.19 | 2.95 | $20.97 | $43,620 |
| North Carolina | 500 | 0.12 | 1.83 | $16.66 | $34,650 |
Solar Photovoltaic Installers – Highest Proportional Concentrations by Metropolitan Area
The following shows the metropolitan areas with the highest concentration of jobs, relative to the nation as a whole, for solar photovoltaic installers.
| Metropolitan area | Employment | Employment per thousand jobs | Location quotient | Hourly mean wage | Annual mean wage |
| San Rafael, CA Metropolitan Division | 120 | 1.07 | 17.02 | $23.45 | $48,770 |
| Oakland-Hayward-Berkeley, CA Metropolitan Division | 540 | 0.47 | 7.52 | $19.92 | $41,440 |
| Santa Rosa, CA | 80 | 0.42 | 6.60 | $26.53 | $55,180 |
| Urban Honolulu, HI | 90 | 0.19 | 2.98 | $29.07 | $60,470 |
| Riverside-San Bernardino-Ontario, CA | 230 | 0.16 | 2.55 | $21.11 | $43,910 |
| Boston-Cambridge-Newton, MA NECTA Division | 190 | 0.10 | 1.61 | $27.64 | $57,490 |
| Wilmington, DE-MD-NJ Metropolitan Division | 30 | 0.10 | 1.51 | $17.08 | $35,520 |
| New York-Jersey City-White Plains, NY-NJ Metropolitan Division | 620 | 0.09 | 1.46 | $20.59 | $42,820 |
| Charlotte-Concord-Gastonia, NC-SC | 70 | 0.06 | 0.99 | $14.78 | $30,730 |
| San Francisco-Redwood City-South San Francisco, CA Metropolitan Division | 40 | 0.04 | 0.63 | $23.93 | $49,780 |
Computer Numerically Controlled Machine Tool Programmers, Metal and Plastic Outlook
Computer numerically controlled machine tool programmers, metal and plastic is projected to be one of the fastest growing occupations in the Specialty Trade Contractors industry.
Computer Numerically Controlled Machine Tool Programmers, Metal and Plastic – Size and Growth
The following indicates the projected size and growth for computer numerically controlled machine tool programmers, metal and plastic.
| Occupation | 2026 Projected Employment (in thousands) | 2026 Projected Percent of Subsector | Percent Employment Change (2016-2026) | Education Requirements | OJT Requirements |
| Computer numerically controlled machine tool programmers, metal and plastic | 0.1 | 0.0 | 31.8 | High school diploma or equivalent | Long-term on-the-job training |
Computer Numerically Controlled Machine Tool Programmers, Metal and Plastic – Highest Proportional Concentrations by State
The following shows the states with the highest concentration of jobs, relative to the nation as a whole, for computer numerically controlled machine tool programmers, metal and plastic.
| State | Employment | Employment per thousand jobs | Location quotient | Hourly mean wage | Annual mean wage |
| Wisconsin | 1,420 | 0.50 | 3.01 | $25.89 | $53,860 |
| Michigan | 2,100 | 0.49 | 2.95 | $24.99 | $51,990 |
| Connecticut | 770 | 0.47 | 2.79 | $32.34 | $67,270 |
| Kansas | 610 | 0.44 | 2.67 | $29.18 | $60,700 |
| New Hampshire | 230 | 0.36 | 2.13 | $28.26 | $58,790 |
Computer Numerically Controlled Machine Tool Programmers, Metal and Plastic – Highest Proportional Concentrations by Metropolitan Area
The following shows the metropolitan areas with the highest concentration of jobs, relative to the nation as a whole, for computer numerically controlled machine tool programmers, metal and plastic.
| Metropolitan area | Employment | Employment per thousand jobs | Location quotient | Hourly mean wage | Annual mean wage |
| Jackson, MI | 130 | 2.22 | 13.28 | $25.46 | $52,960 |
| Wichita, KS | 330 | 1.12 | 6.71 | $35.34 | $73,520 |
| Niles-Benton Harbor, MI | 70 | 1.06 | 6.35 | $25.37 | $52,770 |
| Anniston-Oxford-Jacksonville, AL | 40 | 1.00 | 5.99 | $21.66 | $45,050 |
| Racine, WI | 70 | 0.94 | 5.64 | $21.51 | $44,750 |
| Florence-Muscle Shoals, AL | 50 | 0.90 | 5.39 | $18.51 | $38,500 |
| Haverhill-Newburyport-Amesbury Town, MA-NH NECTA Division | 60 | 0.88 | 5.25 | $29.67 | $61,700 |
| Mansfield, OH | 40 | 0.86 | 5.13 | $18.67 | $38,840 |
| Hartford-West Hartford-East Hartford, CT | 450 | 0.77 | 4.62 | $34.71 | $72,210 |
| Rockford, IL | 110 | 0.76 | 4.57 | $25.25 | $52,510 |
Stationary Engineers and Boiler Operators Outlook
Stationary engineers and boiler operators is projected to be one of the fastest growing occupations in the Specialty Trade Contractors industry.
Stationary Engineers and Boiler Operators – Size and Growth
The following indicates the projected size and growth for stationary engineers and boiler operators.
| Occupation | 2026 Projected Employment (in thousands) | 2026 Projected Percent of Subsector | Percent Employment Change (2016-2026) | Education Requirements | OJT Requirements |
| Stationary engineers and boiler operators | 0.3 | 0.0 | 19.6 | High school diploma or equivalent | Long-term on-the-job training |
Stationary Engineers and Boiler Operators – Highest Proportional Concentrations by State
The following shows the states with the highest concentration of jobs, relative to the nation as a whole, for stationary engineers and boiler operators.
| State | Employment | Employment per thousand jobs | Location quotient | Hourly mean wage | Annual mean wage |
| District of Columbia | 730 | 1.03 | 4.46 | $36.97 | $76,900 |
| Nebraska | 500 | 0.51 | 2.23 | $22.66 | $47,130 |
| Maine | 300 | 0.51 | 2.21 | $24.00 | $49,920 |
| Montana | 210 | 0.46 | 1.99 | $25.41 | $52,850 |
| Maryland | 1,160 | 0.44 | 1.89 | $27.74 | $57,700 |
Stationary Engineers and Boiler Operators – Highest Proportional Concentrations by Metropolitan Area
The following shows the metropolitan areas with the highest concentration of jobs, relative to the nation as a whole, for stationary engineers and boiler operators.
| Metropolitan area | Employment | Employment per thousand jobs | Location quotient | Hourly mean wage | Annual mean wage |
| Danville, IL | 40 | 1.36 | 5.89 | $23.60 | $49,090 |
| Bloomsburg-Berwick, PA | 50 | 1.18 | 5.12 | $22.14 | $46,050 |
| Worcester, MA-CT | 270 | 0.95 | 4.14 | $30.64 | $63,740 |
| Albany-Schenectady-Troy, NY | 380 | 0.85 | 3.69 | $25.35 | $52,730 |
| Albany, OR | 30 | 0.78 | 3.37 | $26.36 | $54,840 |
| Glens Falls, NY | 40 | 0.72 | 3.13 | $31.00 | $64,490 |
| Omaha-Council Bluffs, NE-IA | 340 | 0.70 | 3.05 | $22.97 | $47,780 |
| Kennewick-Richland, WA | 80 | 0.70 | 3.06 | $35.35 | $73,530 |
| Springfield, IL | 70 | 0.69 | 3.02 | $46.11 | $95,900 |
| Grand Forks, ND-MN | 30 | 0.69 | 3.00 | $25.40 | $52,840 |
Helpers–Pipelayers, Plumbers, Pipefitters, and Steamfitters Outlook
Helpers–pipelayers, plumbers, pipefitters, and steamfitters is projected to be one of the fastest growing occupations in the Specialty Trade Contractors industry.
Helpers–Pipelayers, Plumbers, Pipefitters, and Steamfitters – Size and Growth
The following indicates the projected size and growth for helpers–pipelayers, plumbers, pipefitters, and steamfitters.
| Occupation | 2026 Projected Employment (in thousands) | 2026 Projected Percent of Subsector | Percent Employment Change (2016-2026) | Education Requirements | OJT Requirements |
| Helpers–pipelayers, plumbers, pipefitters, and steamfitters | 52.1 | 1.1 | 19.5 | High school diploma or equivalent | Short-term on-the-job training |
Helpers–Pipelayers, Plumbers, Pipefitters, and Steamfitters – Highest Proportional Concentrations by State
The following shows the states with the highest concentration of jobs, relative to the nation as a whole, for helpers–pipelayers, plumbers, pipefitters, and steamfitters.
| State | Employment | Employment per thousand jobs | Location quotient | Hourly mean wage | Annual mean wage |
| Louisiana | 3,170 | 1.67 | 4.34 | $15.91 | $33,100 |
| New Mexico | 750 | 0.94 | 2.44 | $15.52 | $32,270 |
| District of Columbia | 600 | 0.85 | 2.20 | $19.38 | $40,320 |
| Texas | 9,520 | 0.80 | 2.08 | $15.36 | $31,940 |
| South Carolina | 1,420 | 0.71 | 1.84 | $14.28 | $29,710 |
Helpers–Pipelayers, Plumbers, Pipefitters, and Steamfitters – Highest Proportional Concentrations by Metropolitan Area
The following shows the metropolitan areas with the highest concentration of jobs, relative to the nation as a whole, for helpers–pipelayers, plumbers, pipefitters, and steamfitters.
| Metropolitan area | Employment | Employment per thousand jobs | Location quotient | Hourly mean wage | Annual mean wage |
| Lake Charles, LA | 860 | 7.68 | 19.97 | (8) | (8) |
| Hattiesburg, MS | 120 | 1.97 | 5.13 | $12.58 | $26,160 |
| Baton Rouge, LA | 750 | 1.90 | 4.95 | $14.44 | $30,030 |
| Ogden-Clearfield, UT | 450 | 1.81 | 4.70 | $15.34 | $31,910 |
| New Orleans-Metairie, LA | 920 | 1.66 | 4.31 | $14.35 | $29,840 |
| Alexandria, LA | 100 | 1.60 | 4.17 | $15.06 | $31,320 |
| Jacksonville, FL | 1,010 | 1.52 | 3.95 | $12.74 | $26,500 |
| Santa Fe, NM | 80 | 1.37 | 3.56 | $15.95 | $33,180 |
| Hammond, LA | 60 | 1.36 | 3.55 | $14.97 | $31,150 |
| Austin-Round Rock, TX | 1,310 | 1.31 | 3.41 | $13.78 | $28,660 |