OJT.com – Your First Stop for 2026 Training and Career Opportunities
OJT.com – Your First Stop for 2026 Training and Career Opportunities to assess the most opportunistic areas for training providers and occupation seekers in the 2026 timeframe.
Our analysis of industry data shows you the industries with the steepest growth trajectory in each state and the industries with the steepest growth trajectory, relative to their peer industries, in an industry group.
Data is derived from published data by the Bureau of Labor Statistics
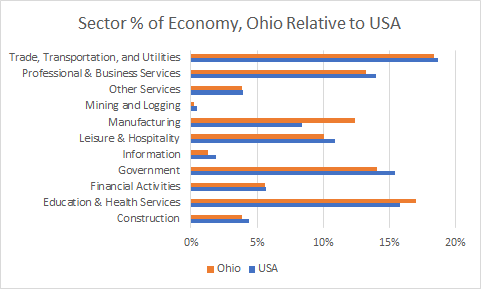
Figure 1 provides a typical state chart that shows the percentage of all sectors employ relative to the percentage of those sectors employ in the country at large. From the chart, it is apparent that Ohio is a hotbed for Manufacturing.
Figure 1. Ohio Sector Employment
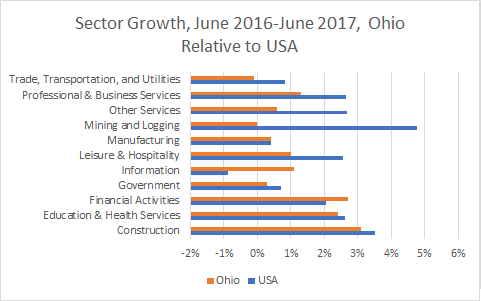
 Figure 2 shows the growth of the sectors, over the year from June 2016 to June 2017. The growth picture indicates that Ohio looks like it may become a hotbed for the Information sector. Software programming is an industry in the Information sector and I suspect this is where much of the growth is coming from.
Figure 2. Ohio Sector Growth
 If I were a training provider or career seeker in the Manufacturing or Information space, I’d definitely give Ohio a closer look. I’d also go to the Manufacturing and Information industry pages, on OJT.com, to drill into these sectors to see which subsectors provide the most opportunity.
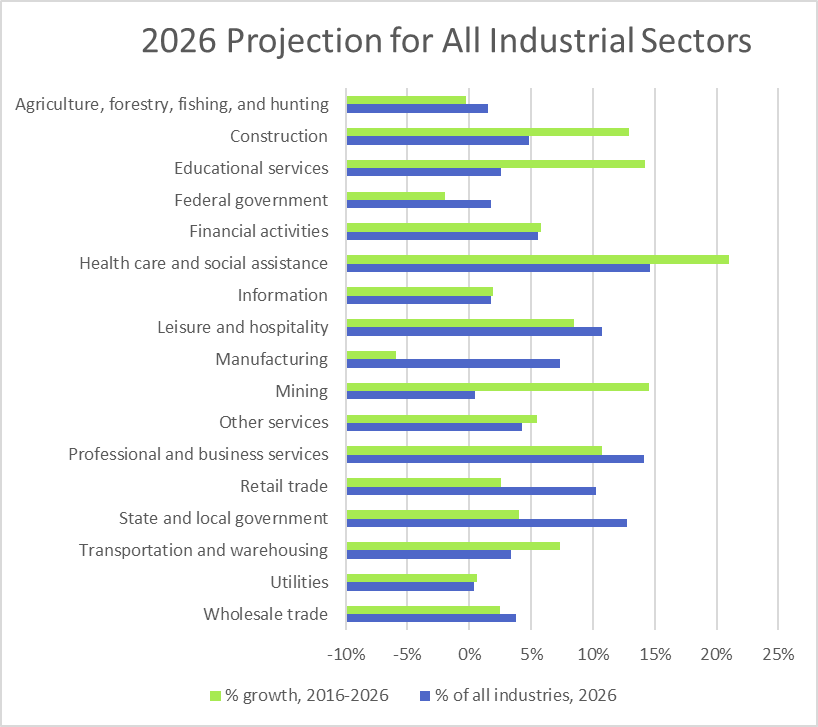
Figure 3 shows the expected growth for each of the main industrial sectors, relative to the size of that sector in the overall economy. The average growth rate across all sectors is 5.8%. Anything larger than that indicates an expanding sector and anything less than that indicates a shrinking sector, relative to the other sectors in the economy.
Figure 3. Size and Growth Projections for All Industrial Sectors
 The Health Care and Social Assistance sector indicates a remarkable amount of growth. To find out where most of this growth is coming from, I’d go to the detailed industry page for this sector. Figure 4 shows the chart for growth within the Health Care and Social Assistance sector. Ambulatory Health Care Services and Social Assistance appear to be the two main drivers of growth in this sector.
Figure 4. Size and Growth for Health Care and Social Assistance
 Within each industry and industry group, we highlight the 10 largest projected occupations and the 10 occupations with the steepest growth trajectory.
Sticking with Ambulatory Health Care Services, Table 1 and Table 2 show the largest and fastest growing occupations in this industry, along with the related educational and OJT requirements. If I had any interest in this field, targeting these occupations would make a lot of sense.
Table 1. Largest Occupations in Ambulatory Health Care Services, Projected for 2026
| Occupation | 2026 Projected Employment (in thousands) | 2026 Projected Percent of Subsector | Percent Employment Change (2016-2026) | Education Requirements | OJT Requirements |
| Registered nurses | 725.2 | 7.8 | 34.9 | Bachelor’s degree | None |
| Home health aides | 680.2 | 7.3 | 62.9 | No formal educational credential | Short-term on-the-job training |
| Medical assistants | 645.3 | 7.0 | 33.1 | Postsecondary nondegree award | None |
| Personal care aides | 498.8 | 5.4 | 55.0 | No formal educational credential | Short-term on-the-job training |
| Medical secretaries | 467.8 | 5.0 | 28.5 | High school diploma or equivalent | Moderate-term on-the-job training |
| Receptionists and information clerks | 459.3 | 4.9 | 22.7 | High school diploma or equivalent | Short-term on-the-job training |
| Dental assistants | 377.0 | 4.1 | 20.3 | Postsecondary nondegree award | None |
| Licensed practical and licensed vocational nurses | 283.8 | 3.1 | 34.1 | Postsecondary nondegree award | None |
| Dental hygienists | 241.2 | 2.6 | 20.1 | Associate’s degree | None |
| Office clerks, general | 229.9 | 2.5 | 13.7 | High school diploma or equivalent | Short-term on-the-job training |
Table 2. Highest Growth Occupations in Ambulatory Health Care Services, Projected thru 2026
| Occupation | 2026 Projected Employment (in thousands) | 2026 Projected Percent of Subsector | Percent Employment Change (2016-2026) | Education Requirements | OJT Requirements |
| Home health aides | 680.2 | 7.3 | 62.9 | No formal educational credential | Short-term on-the-job training |
| Statisticians | 1.0 | 0.0 | 55.3 | Master’s degree | None |
| Personal care aides | 498.8 | 5.4 | 55.0 | No formal educational credential | Short-term on-the-job training |
| Health specialties teachers, postsecondary | 2.1 | 0.0 | 54.2 | Doctoral or professional degree | None |
| Massage therapists | 53.1 | 0.6 | 49.9 | Postsecondary nondegree award | None |
| Operations research analysts | 1.0 | 0.0 | 49.3 | Bachelor’s degree | None |
| Clergy | 8.7 | 0.1 | 47.4 | Bachelor’s degree | Moderate-term on-the-job training |
| Waiters and waitresses | 0.2 | 0.0 | 47.4 | No formal educational credential | Short-term on-the-job training |
| Medical and health services managers | 151.0 | 1.6 | 47.1 | Bachelor’s degree | None |
| Nurse practitioners | 135.0 | 1.5 | 46.2 | Master’s degree | None |
In conclusion, training providers can use our industry information to assess future-looking demand for on-the-job training programs. Occupation seekers can this information to plan their careers and to seek out the on-the-job training required for the highest in-demand occupations in the near future.
Training providers and occupation seekers can use the state data to see in which state it makes the most sense to focus their efforts.


