

Financial Activities – Relative Sector Size and Growth
The Bureau of Labor Statistics indicates that the Financial Activities sector will grow substantially over the next several years.
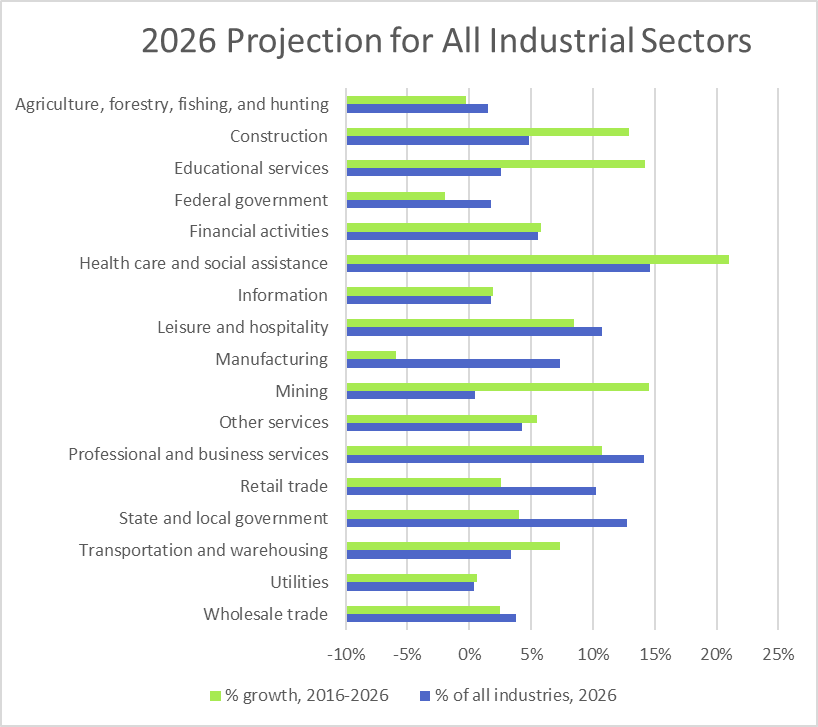
Projected Growth for Main Industry Sectors
Insurance Carriers and Related Activities
Within the Financial Activities sector, Insurance Carriers and Related Activities is a large and growing industry.

Finance and Insurance
Insurance Carriers and Related Activities Industry Groups
The Insurance Carriers and Related Activities industry includes the following industry groups:
- Insurance Carriers
- Agencies, Brokerages, and Other Insurance Related Activities
Other Information Services Insurance Carriers and Related Activities Occupational Opportunities
The following lists the largest and fastest growing occupations in the Other Information Services industry for 2026.
- Insurance sales agents
- Insurance claims and policy processing clerks
- Claims adjusters, examiners, and investigators
- Insurance underwriters
- Eligibility interviewers, government programs
- Medical transcriptionists
Insurance Sales Agents Outlook
Insurance sales agents are projected to be one of the largest occupations in the Other Information Services Insurance Carriers and Related Activities industry.
Insurance Sales Agents – Size and Growth
The following indicates the projected size and growth for insurance sales agents.
| Occupation | 2026 Projected Employment (in thousands) | 2026 Projected Percent of Subsector | Percent Employment Change (2016-2026) | Education Requirements | OJT Requirements |
| Insurance sales agents | 433.3 | 15.8 | 10.1 | High school diploma or equivalent | Moderate-term on-the-job training |
Insurance Sales Agents – Highest Proportional Concentrations by State
The following shows the states with the highest concentration of jobs, relative to the nation as a whole, for insurance sales agents.
| State | Employment | Employment per thousand jobs | Location quotient | Hourly mean wage | Annual mean wage |
| South Dakota | 1,850 | 4.42 | 1.63 | $31.14 | $64,760 |
| Iowa | 6,480 | 4.22 | 1.56 | $28.05 | $58,340 |
| Nebraska | 3,840 | 3.96 | 1.46 | $29.30 | $60,940 |
| Florida | 33,000 | 3.92 | 1.45 | $32.28 | $67,140 |
| Colorado | 9,880 | 3.87 | 1.43 | $31.27 | $65,030 |
Insurance Sales Agents – Highest Proportional Concentrations by Metropolitan Area
The following shows the metropolitan areas with the highest concentration of jobs, relative to the nation as a whole, for insurance sales agents.
| Metropolitan area | Employment | Employment per thousand jobs | Location quotient | Hourly mean wage | Annual mean wage |
| Des Moines-West Des Moines, IA | 2,340 | 6.43 | 2.37 | $30.40 | $63,230 |
| Hartford-West Hartford-East Hartford, CT | 3,650 | 6.27 | 2.31 | $35.83 | $74,530 |
| Bloomington, IN | 380 | 5.60 | 2.07 | $18.51 | $38,500 |
| Columbia, SC | 1,950 | 5.28 | 1.95 | $28.93 | $60,180 |
| Tampa-St. Petersburg-Clearwater, FL | 6,640 | 5.19 | 1.91 | $32.96 | $68,550 |
| Hot Springs, AR | 180 | 5.18 | 1.91 | $23.29 | $48,450 |
| Amarillo, TX | 570 | 5.02 | 1.85 | $27.41 | $57,020 |
| Tallahassee, FL | 850 | 5.01 | 1.85 | $26.93 | $56,010 |
| Portland-South Portland, ME | 1,020 | 5.00 | 1.85 | $24.19 | $50,310 |
| Birmingham-Hoover, AL | 2,470 | 4.90 | 1.81 | $40.99 | $85,260 |
Insurance Claims and Policy Processing Clerks Outlook
Insurance claims and policy processing clerks is projected to be one of the largest occupations in the Other Information Services Insurance Carriers and Related Activities industry.
Insurance Claims and Policy Processing Clerks – Size and Growth
The following indicates the projected size and growth for insurance claims and policy processing clerks.
| Occupation | 2026 Projected Employment (in thousands) | 2026 Projected Percent of Subsector | Percent Employment Change (2016-2026) | Education Requirements | OJT Requirements |
| Insurance claims and policy processing clerks | 293.9 | 10.7 | 10.6 | High school diploma or equivalent | Moderate-term on-the-job training |
Insurance Claims and Policy Processing Clerks – Highest Proportional Concentrations by State
The following shows the states with the highest concentration of jobs, relative to the nation as a whole, for insurance claims and policy processing clerks.
| State | Employment | Employment per thousand jobs | Location quotient | Hourly mean wage | Annual mean wage |
| Nebraska | 3,170 | 3.27 | 1.68 | $18.50 | $38,490 |
| Connecticut | 5,000 | 3.02 | 1.55 | $23.59 | $49,060 |
| Ohio | 16,050 | 2.99 | 1.54 | $18.71 | $38,920 |
| Texas | 33,620 | 2.83 | 1.45 | $19.14 | $39,800 |
| South Dakota | 1,170 | 2.80 | 1.44 | $15.60 | $32,440 |
Insurance Claims and Policy Processing Clerks – Highest Proportional Concentrations by Metropolitan Area
The following shows the metropolitan areas with the highest concentration of jobs, relative to the nation as a whole, for insurance claims and policy processing clerks.
| Metropolitan area | Employment | Employment per thousand jobs | Location quotient | Hourly mean wage | Annual mean wage |
| La Crosse-Onalaska, WI-MN | 570 | 7.75 | 3.99 | $16.42 | $34,160 |
| Cheyenne, WY | 340 | 7.51 | 3.86 | $17.20 | $35,770 |
| Sherman-Denison, TX | 310 | 6.84 | 3.52 | $17.88 | $37,190 |
| Lincoln, NE | 1,010 | 5.76 | 2.96 | $17.84 | $37,120 |
| Hartford-West Hartford-East Hartford, CT | 3,310 | 5.69 | 2.93 | $24.31 | $50,560 |
| Manchester, NH | 630 | 5.58 | 2.87 | $19.90 | $41,380 |
| Sioux Falls, SD | 830 | 5.48 | 2.82 | $15.89 | $33,060 |
| Sheboygan, WI | 320 | 5.45 | 2.81 | $22.26 | $46,290 |
| Roanoke, VA | 830 | 5.43 | 2.79 | $19.76 | $41,090 |
| Olympia-Tumwater, WA | 590 | 5.38 | 2.77 | $23.42 | $48,710 |
Claims Adjusters, Examiners, and Investigators Outlook
Claims adjusters, examiners, and investigators are projected to be one of the largest occupations in the Other Information Services Insurance Carriers and Related Activities industry.
Claims Adjusters, Examiners, and Investigators – Size and Growth
The following indicates the projected size and growth for claims adjusters, examiners, and investigators.
| Occupation | 2026 Projected Employment (in thousands) | 2026 Projected Percent of Subsector | Percent Employment Change (2016-2026) | Education Requirements | OJT Requirements |
| Claims adjusters, examiners, and investigators | 220.8 | 8.0 | -0.1 | High school diploma or equivalent | Long-term on-the-job training |
Claims Adjusters, Examiners, and Investigators – Highest Proportional Concentrations by State
The following shows the states with the highest concentration of jobs, relative to the nation as a whole, for claims adjusters, examiners, and investigators.
| State | Employment | Employment per thousand jobs | Location quotient | Hourly mean wage | Annual mean wage |
| Arizona | 9,220 | 3.41 | 1.72 | $32.43 | $67,450 |
| Connecticut | 4,690 | 2.84 | 1.43 | $36.13 | $75,160 |
| Montana | 1,300 | 2.81 | 1.42 | $25.79 | $53,630 |
| New Jersey | 10,720 | 2.67 | 1.35 | $35.34 | $73,500 |
| Missouri | 7,230 | 2.59 | 1.31 | $30.83 | $64,130 |
Claims Adjusters, Examiners, and Investigators – Highest Proportional Concentrations by Metropolitan Area
The following shows the metropolitan areas with the highest concentration of jobs, relative to the nation as a whole, for claims adjusters, examiners, and investigators.
| Metropolitan area | Employment | Employment per thousand jobs | Location quotient | Hourly mean wage | Annual mean wage |
| Bloomington, IL | 1,200 | 13.43 | 6.79 | $31.53 | $65,580 |
| Great Falls, MT | 360 | 9.98 | 5.05 | $18.05 | $37,540 |
| Waco, TX | 1,050 | 8.99 | 4.55 | $31.29 | $65,090 |
| Dover-Durham, NH-ME | 430 | 8.48 | 4.29 | $36.90 | $76,750 |
| Olympia-Tumwater, WA | 850 | 7.73 | 3.91 | $27.99 | $58,230 |
| Wausau, WI | 510 | 7.34 | 3.71 | $33.51 | $69,710 |
| Jefferson City, MO | 490 | 6.58 | 3.33 | $20.55 | $42,750 |
| Charleston, WV | 660 | 5.90 | 2.98 | $23.30 | $48,470 |
| Manchester, NH | 610 | 5.43 | 2.74 | $28.94 | $60,190 |
| Harrisburg-Carlisle, PA | 1,760 | 5.43 | 2.74 | $27.92 | $58,070 |
Insurance Underwriters Outlook
Insurance underwriters is projected to be one of the largest occupations in the Other Information Services Insurance Carriers and Related Activities industry.
Insurance Underwriters – Size and Growth
The following indicates the projected size and growth for insurance underwriters.
| Occupation | 2026 Projected Employment (in thousands) | 2026 Projected Percent of Subsector | Percent Employment Change (2016-2026) | Education Requirements | OJT Requirements |
| Insurance underwriters | 86.8 | 3.2 | -6.0 | Bachelor’s degree | Moderate-term on-the-job training |
Insurance Underwriters – Highest Proportional Concentrations by State
The following shows the states with the highest concentration of jobs, relative to the nation as a whole, for insurance underwriters.
| State | Employment | Employment per thousand jobs | Location quotient | Hourly mean wage | Annual mean wage |
| Connecticut | 2,790 | 1.69 | 2.68 | $40.00 | $83,200 |
| Nebraska | 1,540 | 1.59 | 2.51 | $33.54 | $69,760 |
| Georgia | 5,500 | 1.28 | 2.03 | $40.63 | $84,500 |
| Iowa | 1,810 | 1.18 | 1.87 | $32.35 | $67,290 |
| Illinois | 5,920 | 1.00 | 1.58 | $37.02 | $76,990 |
Insurance Underwriters – Highest Proportional Concentrations by Metropolitan Area
The following shows the metropolitan areas with the highest concentration of jobs, relative to the nation as a whole, for insurance underwriters.
| Metropolitan area | Employment | Employment per thousand jobs | Location quotient | Hourly mean wage | Annual mean wage |
| Bloomington, IL | 900 | 10.16 | 16.12 | $33.71 | $70,110 |
| Sheboygan, WI | 210 | 3.70 | 5.87 | $28.51 | $59,310 |
| Columbia, MO | 310 | 3.38 | 5.36 | $26.08 | $54,240 |
| Des Moines-West Des Moines, IA | 1,220 | 3.35 | 5.31 | $34.91 | $72,620 |
| Utica-Rome, NY | 390 | 3.17 | 5.02 | $39.59 | $82,360 |
| Hartford-West Hartford-East Hartford, CT | 1,680 | 2.89 | 4.58 | $38.09 | $79,230 |
| Lansing-East Lansing, MI | 590 | 2.76 | 4.37 | $28.49 | $59,250 |
| Lincoln, NE | 480 | 2.73 | 4.33 | $34.31 | $71,370 |
| Omaha-Council Bluffs, NE-IA | 970 | 1.99 | 3.15 | $33.38 | $69,420 |
| Atlanta-Sandy Springs-Roswell, GA | 4,950 | 1.89 | 3.00 | $41.44 | $86,190 |
Eligibility Interviewers, Government Programs Outlook
Eligibility interviewers, government programs is projected to be one of the fastest growing occupations in the Other Information Services Insurance Carriers and Related Activities industry.
Eligibility Interviewers, Government Programs – Size and Growth
The following indicates the projected size and growth for eligibility interviewers, government programs.
| Occupation | 2026 Projected Employment (in thousands) | 2026 Projected Percent of Subsector | Percent Employment Change (2016-2026) | Education Requirements | OJT Requirements |
| Eligibility interviewers, government programs | 0.6 | 0.0 | 29.2 | High school diploma or equivalent | Moderate-term on-the-job training |
Eligibility Interviewers, Government Programs – Highest Proportional Concentrations by State
The following shows the states with the highest concentration of jobs, relative to the nation as a whole, for eligibility interviewers, government programs.
| State | Employment | Employment per thousand jobs | Location quotient | Hourly mean wage | Annual mean wage |
| Alaska | 540 | 1.71 | 1.73 | $25.99 | $54,060 |
| Pennsylvania | 9,040 | 1.56 | 1.58 | $23.34 | $48,560 |
| North Carolina | 6,630 | 1.54 | 1.56 | $18.27 | $38,000 |
| California | 25,430 | 1.52 | 1.54 | $23.58 | $49,050 |
| Alabama | 2,930 | 1.52 | 1.54 | $19.68 | $40,940 |
Eligibility Interviewers, Government Programs – Highest Proportional Concentrations by Metropolitan Area
The following shows the metropolitan areas with the highest concentration of jobs, relative to the nation as a whole, for eligibility interviewers, government programs.
| Metropolitan area | Employment | Employment per thousand jobs | Location quotient | Hourly mean wage | Annual mean wage |
| Fresno, CA | 2,390 | 6.42 | 6.51 | $21.66 | $45,050 |
| Topeka, KS | 630 | 5.79 | 5.87 | $19.27 | $40,070 |
| Waco, TX | 480 | 4.13 | 4.19 | $18.14 | $37,730 |
| Lynn-Saugus-Marblehead, MA NECTA Division | 170 | 3.93 | 3.99 | $27.29 | $56,760 |
| Ogden-Clearfield, UT | 960 | 3.83 | 3.89 | $21.78 | $45,300 |
| Altoona, PA | 200 | 3.41 | 3.46 | $21.54 | $44,800 |
| Philadelphia, PA Metropolitan Division | 3,010 | 3.33 | 3.37 | $24.29 | $50,520 |
| Scranton–Wilkes-Barre–Hazleton, PA | 850 | 3.31 | 3.35 | $22.89 | $47,600 |
| Salem, OR | 470 | 2.83 | 2.87 | $18.17 | $37,790 |
| Bloomsburg-Berwick, PA | 110 | 2.65 | 2.69 | $21.46 | $44,640 |
Medical Transcriptionists Outlook
Medical transcriptionists is projected to be one of the fastest growing occupations in the Other Information Services Insurance Carriers and Related Activities industry.
Medical Transcriptionists – Size and Growth
The following indicates the projected size and growth for medical transcriptionists.
| Occupation | 2026 Projected Employment (in thousands) | 2026 Projected Percent of Subsector | Percent Employment Change (2016-2026) | Education Requirements | OJT Requirements |
| Medical transcriptionists | 0.2 | 0.0 | 29.0 | Postsecondary nondegree award | None |
Medical Transcriptionists – Highest Proportional Concentrations by State
The following shows the states with the highest concentration of jobs, relative to the nation as a whole, for medical transcriptionists.
| State | Employment | Employment per thousand jobs | Location quotient | Hourly mean wage | Annual mean wage |
| South Dakota | 520 | 1.24 | 3.17 | $16.14 | $33,570 |
| Florida | 6,620 | 0.79 | 2.01 | $17.08 | $35,530 |
| Idaho | 530 | 0.78 | 1.98 | $14.92 | $31,030 |
| Oregon | 1,220 | 0.66 | 1.70 | $18.79 | $39,080 |
| Kansas | 870 | 0.63 | 1.62 | $14.27 | $29,680 |
Medical Transcriptionists – Highest Proportional Concentrations by Metropolitan Area
The following shows the metropolitan areas with the highest concentration of jobs, relative to the nation as a whole, for medical transcriptionists.
| Metropolitan area | Employment | Employment per thousand jobs | Location quotient | Hourly mean wage | Annual mean wage |
| Elizabethtown-Fort Knox, KY | 160 | 2.99 | 7.63 | $15.97 | $33,220 |
| Rapid City, SD | 120 | 1.77 | 4.51 | $16.61 | $34,540 |
| Roanoke, VA | 260 | 1.72 | 4.39 | $14.42 | $30,000 |
| Orlando-Kissimmee-Sanford, FL | 1,940 | 1.61 | 4.10 | $17.09 | $35,540 |
| Fort Worth-Arlington, TX Metropolitan Division | 1,510 | 1.52 | 3.88 | $12.37 | $25,730 |
| Tucson, AZ | 540 | 1.47 | 3.74 | $11.88 | $24,700 |
| Topeka, KS | 150 | 1.37 | 3.49 | $11.09 | $23,060 |
| Sioux Falls, SD | 190 | 1.24 | 3.16 | $16.51 | $34,350 |
| Chico, CA | 100 | 1.20 | 3.05 | $20.82 | $43,310 |
| Tampa-St. Petersburg-Clearwater, FL | 1,520 | 1.19 | 3.03 | $19.17 | $39,880 |